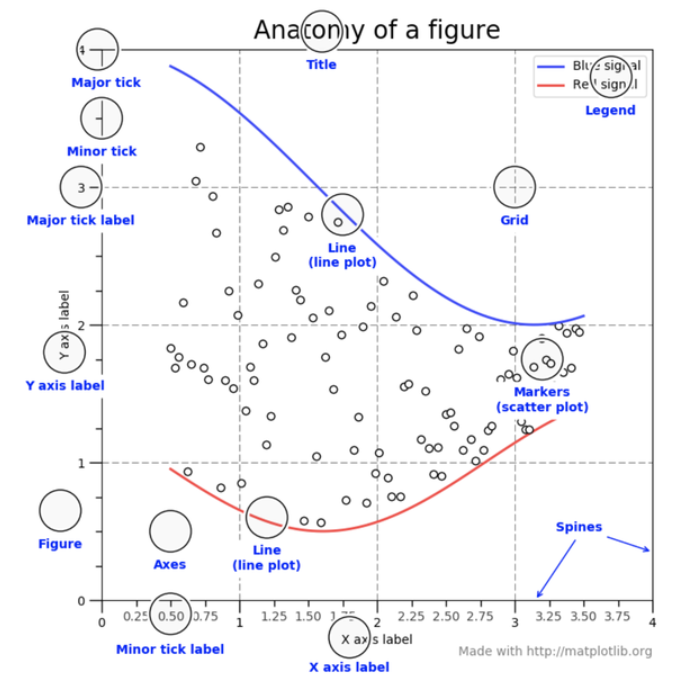
STEP 1. 막대(Bar) 그래프 import matplotlib.pyplot as plt %matplotlib inline # 그래프 데이터 subject = ['English', 'Math', 'Korean', 'Science', 'Computer'] points = [40, 90, 50, 60, 100] # 축 그리기 fig = plt.figure() ax1 = fig.add_subplot(1,1,1) # 그래프 그리기 ax1.bar(subject, points) # 라벨, 타이틀 달기 plt.xlabel('Subject') plt.ylabel('Points') plt.title("Yuna's Test Result") # 보여주기 plt.savefig('./barplot.png') # 그래프를 이..
원문링크 : Matplotlib




 네이버 블로그
 티스토리
티스토리 커뮤니티
커뮤니티