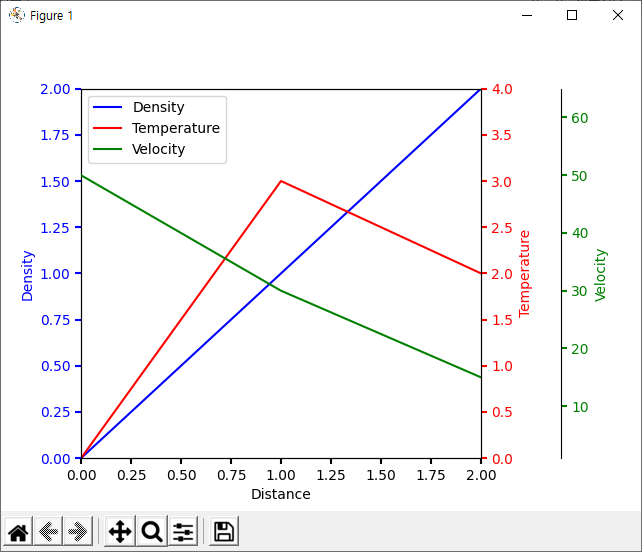
해당 코드는 아래 참조 링크에서 가져왔다. 아래는 코드, 코드 해석, 결과 화면이다. import matplotlib.pyplot as plt def make_patch_spines_invisible(ax): ax.set_frame_on(True) ax.patch.set_visible(False) for sp in ax.spines.values(): sp.set_visible(False) fig, host = plt.subplots() fig.subplots_adjust(right=0.75) par1 = host.twinx() par2 = host.twinx() # Offset the right spine of par2. The ticks and label have already been # placed..
원문링크 : multiple plot in one figure (여러 plot 한 화면에 표기)


![[Python] 코스피, 코스닥 값 불러와서 분석하기(pandas) [Python] 코스피, 코스닥 값 불러와서 분석하기(pandas)](http://img1.daumcdn.net/thumb/R800x0/?scode=mtistory2&fname=https%3A%2F%2Fblog.kakaocdn.net%2Fdn%2FYTalz%2Fbtri5kmHla3%2F93Lhyq8jHHx6t7yOZPiKyK%2Fimg.jpg)

![[선형대수학]행렬(Matrix) 곱셈의 의미, Span, Linear Combination: 내적(Dot Product),Rank1,열공간(Column Space),행공간(Row Space) [선형대수학]행렬(Matrix) 곱셈의 의미, Span, Linear Combination: 내적(Dot Product),Rank1,열공간(Column Space),행공간(Row Space)](http://img1.daumcdn.net/thumb/R800x0/?scode=mtistory2&fname=https%3A%2F%2Fblog.kakaocdn.net%2Fdn%2FovaJ8%2Fbtr2RXF0dRd%2FyTfNDK5OquicKA3mu2z1kk%2Fimg.png)


![[Python]OpenCV 마우스 이벤트/클릭(Mouse Event, Click) 콜백함수 [Python]OpenCV 마우스 이벤트/클릭(Mouse Event, Click) 콜백함수](http://img1.daumcdn.net/thumb/R800x0/?scode=mtistory2&fname=https%3A%2F%2Fblog.kakaocdn.net%2Fdn%2Fbirub1%2FbtrxLk0M8ax%2FvthuHxhmjqe9HBDSP54Mp0%2Fimg.png)
 네이버 블로그
 티스토리
티스토리 커뮤니티
커뮤니티